m (1 revision) |
Revision as of 19:04, 24 October 2011
Contents
|
Preface
OpenClovis Log Tool User Guide provides information about the usage of OpenClovis Log Tool.
OpenClovis Log Tool is an interactive utility that allows you to view binary log files in a readable format and hence monitor system errors, warnings, and other log information. By analyzing this information, you can troubleshoot the errors. These log files are in raw format and hard to read. Log Tool allows you to format the files and filter them for the required entries.
Documentation Conventions
This guide uses different fonts and symbols to differentiate between document elements and types of information. These conventions are summarized in the following table:
| Notation | Description |
|---|---|
|
This font denotes various commands and their usage. |
|
Cross reference |
This font denotes a hyperlink. You can click on the hyperlink text to access the reference location, which can be either a section within the User Guide or a URL link. A cross reference refers to a section name accesses the first page of that section. |
|
Bold Text |
Menu items and button names. |
|
Italic Text |
Variables for which you enter values. |
![]() This indicates the presence of notes or annotations, related to the context of the document.
This indicates the presence of notes or annotations, related to the context of the document.
![]() This indicates that certain precautionary measures must be taken before performing a particular task.
This indicates that certain precautionary measures must be taken before performing a particular task.
![]() This indicates that additional information is provided to you.
This indicates that additional information is provided to you.
Document Organization
This guide is organized into various chapters to provide information on specific areas. The following table introduces the chapter names and a brief overview of the content.
| Chapter | Overview |
|---|---|
|
Preface |
This chapter gives an introduction to OpenClovis Log Tool. |
|
Available Tools |
This chapter helps you understand the conceptual information, advantages and key features of OpenClovis Log Tools. It provides information to access the available Log Tools, Command Line Log Tool and Offline GUI Log Tool. |
Related Documents
For additional information about OpenClovis products, refer to the following guides:
- OpenClovis Release Notes provides information about the software and the hardware required to install OpenClovis Application Service Platform (SAFplus Platform) and Integrated Development Environment (IDE). It contains the additional features and enhancements of the product since the previous release. It also summarizes the issues and limitations of the product and provides workarounds wherever applicable.
- OpenClovis SA Forum Compliance describes the level of compliance of OpenClovis SAFplus Platform and its Application Programming Interface (API) with the relevant Service Availability Forum Specifications.
- OpenClovis Installation Guide provides the system requirements, installation procedure for OpenClovis SAFplus Platform, IDE, and the Evaluation System.
- OpenClovis Sample Application Tutorial provides the steps to create and build a sample model using OpenClovis IDE and OpenClovis SAFplus Platform. It also provides troubleshooting information for this process. This provides the logical first step in understanding the OpenClovis offering.
- OpenClovis Evaluation System User Guide provides all the required information to configure and run the sample models packaged within the Evaluation System. This document also provides good understanding of OpenClovis SAFplus Platform's functionality. This is the natural follow on to the OpenClovis Sample Application Tutorial as it builds on the example created in that document.
- OpenClovis SDK User Guide provides information about OpenClovis Application Service Platform (SAFplus Platform) architecture, various OpenClovis SAFplus Platform components, and their interactions. This guide helps you to configure the OpenClovis SAFplus Platform components, compile, and execute the OpenClovis SAFplus Platform code to build your custom application.
- OpenClovis IDE User Guide describes the usage of Integrated Development Environment (IDE), a graphical development environment that complements the SAFplus Platform platform. This guide helps you to understand how to use the various features of the IDE to build the application.
- OpenClovis API Reference Guide is provided for each component. It describes the Application Programming Interface (API), Service Model, and Management Information Model of the various OpenClovis Application Service Platform (SAFplus Platform) services. It helps the developer to understand the capabilities of the SAFplus Platform services and the APIs provided by these services.
- OpenClovis SAFplus Platform Console Reference Guide provides details about managing applications built on OpenClovis SAFplus Platform using the SAFplus Platform runtime debug console commands. SAFplus Platform Console commands can be used to manage, monitor, and test your application.
OpenClovis Online Technical Support
OpenClovis customers and partners can register on our Web site and receive personalized services and information. If you need any support or assistance while working on OpenClovis products, you can access the following: URL: http://www.openclovis.com. Send your queries to: support@openclovis.com. Open source community support is available at: http://www.openclovis.org/forum
Documentation Feedback
We are interested in hearing from our customers on the documentation provided with the product. Let us know your comments and suggestions on improving the documentation at OpenClovis Inc. Send your comments to: support@openclovis.com. Post your feedback on documentation at: http://www.openclovis.org/forum
Available Log Tools
Log files come in 2 flavors, binary and ASCII. ASCII files are easily viewable using standard Linux editors and tools (vi, emacs, tail, etc). By default OpenClovis writes all of its logs in ASCII format. However you may want to change this to binary format or create your own binary format logs. For the binary format logs OpenClovis provides access using following tools :
Using Command Line Log Tool
The online log viewer is a command line utility which may be used to view the Log Records present in the binary log files. The online log viewer only works on binary log files. To view an ASCII log file simply open them with your favorite editor.
The online log viewer displays the log records after some required conversion. It converts the Severity, StreamId, ComponentId to their corresponding names. This conversion is done using information present in metadata file (cfg file) corresponding to each log file. By default, the online log viewer displays the following fields of a log record:
- SeverityName
- StreamName
- ComponentName
- ServiceId
- MessageId
- TimeStamp
- Message
![]() Its very rare that log viewer does not find the stream id to stream name mapping in cfg file. If it does not then it would display the stream id in place of stream name. Same holds true for component id to component name mapping. In this situation it would not be possible to apply filter on that field.
Its very rare that log viewer does not find the stream id to stream name mapping in cfg file. If it does not then it would display the stream id in place of stream name. Same holds true for component id to component name mapping. In this situation it would not be possible to apply filter on that field.
Online log viewer executable asp_binlogviewer is deployed in bin directory of the SAFplus Platform. This online log viewer may be used in following ways :
- To view log records present in a log file (or a set of log files when multiple log files are present for a logical log file) in real time i.e. when logging is going on. In this case it seeks to the latest record and starts displaying the record from that point (which can even be the last record of the log file). As the Log Server writes, this Log Tool tails the files and prints it to the Console. It automatically detects file rollover and tails the new file.
Usage:asp_binlogviewer -l <log_file_prefix> [-f <filter>] [-t <msg_id_map_file>] [-p <num_prev_recs>] [-c <column(s)>] [-a] [-h|--help] - To convert a binary log file to its corresponding text file (this text file contains the log records in exactly the same format as it is displayed on the console) :
Usage:asp_binlogviewer -L <log_file_path> [-C <cfg_file_path>] [-t <msg_id_map_file>] [-h|--help] User may convert a binary log file to its corresponding text file when logging is going on as well as when it has stopped.
Viewing log records in real time
Specify the location of log files
-l: This is the mandatory option for viewing records in real time.
It is used to specify the common prefix to log files (symbolic links to log files) on file system. <log_file_prefix> is common prefix of log file names.
Example:
The log files are /tmp/logFile.0 /tmp/logFile.1 and /tmp/logFile.2.
Usage:
$ASP_BINDIR/asp_binlogviewer -l /tmp/logFile
Setting Filter on a header field
- -f : User may specify filter on one of the header fields
<filter> should be specified as:
"<header field><comparision operator><value>"
\<header field\> options:
- s - SeverityName
- r - StreamName
- c - ComponentName
- v - ServiceId
- t - TimeStamp
- m - MessageId
\<comparision operator\> options:
-
=Equal To -
!=Not Equal To -
<Less Than -
<=Less Than and Equal To -
>Greater Than -
>=Greater Than and Equal To
Possible \<value\> in a filter:
'value' should be:
- String for following fields : SeverityName, StreamName, ComponentName
- HH:MM:SS for TimeStamp
- Integer for following fields : ServiceId, MessageId
Example:
Set filter on stream name (StreamName) 'CL_LOG_APPLICATION'
Usage:
$ASP_BINDIR/asp_binlogviewer -l <log_file_prefix> -f "r=CL_LOG_APPLICATION"
For time stamp having value greater than 4.30pm...
Usage:
$ASP_BINDIR/asp_binlogviewer -l <log_file_prefix> -f "t>16:30:00"
Specify TLV mapping file
- -t : This option is used when log files contain records of TLV (tag length value) format.
Specify complete path to TLV mapping file.
Example:
tlvmap.txt contains the TLV mapping for log records of log file /tmp/sys.0
Usage:
$ASP_BINDIR/asp_binlogviewer -l /tmp/sys -t tlvmap.txt
Following is a sample TLV map file which contains message id to TLV message mapping. TLV File content should be in following format :
Message_ID<space>Message containing %TLV
where <space> is a single space.
![]() All the %TLV are replaced by their corresponding values from log record's tag, length, value information for that message id.
All the %TLV are replaced by their corresponding values from log record's tag, length, value information for that message id.
Following are the sample content of a TLV map file tlvmap.txt :
 5 Component %TLV was unble to start on node %TLV
 6 State Change: Entity [%TLV] Operational State (%TLV -> %TLV) AMF (%TLV)
 7 Registering Component %TLV via eoPort %TLV
 8 Extending %TLV byte pool of %TLV chunkSize
This file contains the message id to string mapping for TLV (tag lengh value) messages. '%TLV' of tlv strings are replaced by the corresponding value found in the log record.
Display previous log records
- -p: Display
<num_prev_recs>previous log records and exit
<num_prev_recs> is the number of previous log records to be displayed. If user specifies a number greater than the maximum log records or number of log records actually present in all the log files then entire log is displayed.
Example:
View 10 previous records
Usage:
$ASP_BINDIR/asp_binlogviewer -l <log_file_prefix> -p 10
Display only selected fields of Log Record
- -c : Display selected field(s) of Log Record
User may choose to display only selected fields of log record. This can be achieved by using -c option where the numbers are separated by ',' .
The default columns are :
- SeverityName
- StreamName
- ComponentName
- ServiceId
- MessageId
- TimeStamp
- Message
Example:
Display only the following fields: StreamName, ServiceId, TimeStamp
Usage:
$ASP_BINDIR/asp_binlogviewer -l <log_file_prefix> -c 2,4,6
Display records present in entire log file(s)
- -a : Display entire log and exit
This option displays all the log records present in a log file or all log files when multiple log files are present for single logical file.
Example:
Display all the log records which file /tmp/sys.0 contains
Usage:
$ASP_BINDIR/asp_binlogviewer -l /tmp/sys -a
Convert a binary log file to text file
Specify complete path to log file
- -L : <log_file_path> is complete path to a log file.
- -C : <cfg_file_prefix> is prefix to cfg (metadata) file. This is an optional argument which is required when log file name and prefix of cfg file are different.
- -t : If log file contains TLV messages then please specify TLV file path using this option.
If log file is /tmp/logFile the corresponding text file will be /tmp/logFile.txt
Example:
When log file name and prefix of cfg files are the same (log file is /tmp/sys_2007-04-18T18:58:36 and cfg file is /tmp/sys_2007-04-18T18:58:36.cfg) :
Usage:
$ASP_BINDIR/asp_binlogviewer -L /tmp/sys_2007-04-18T18:58:36
Example:
When log file name and prefix of cfg files are different (log file is /tmp/sys_2007-04-18T18:58:37 and cfg file is /tmp/sys_2007-04-18T18:58:36.cfg) :
Usage:
$ASP_BINDIR/asp_binlogviewer -L /tmp/sys_2007-04-18T18:58:37 \
                             -C /tmp/sys_2007-04-18T18:58:36
For detailed help use --h or --help
- --help | -h : Display help and exit
Usage:
$ASP_BINDIR/asp_binlogviewer -h
$ASP_BINDIR/asp_binlogviewer --help
Command line log tool Output Format
As the Log Server writes, this Log Tool tails the files and prints it to the Console. It automatically detects file rollover and tails the new file.
The output is of the form:
SEVERITY STREAMNAME COMPONENTNAME SERVICEID MESSAGEID TIMESTAMP MESSAGE
For example,
DEBUG applogs cpmServer_SysController_1 10 0 {Mon Jan 22 17:41:08 2007} \
( 0x6d 0x53 0x27 0x2a 0x97 0x22 0x1e 0x34 )
where,
Debugis the Severityapplogsis the Stream NamecpmServer_SysController_1is the Component Name10is the Service ID{Mon Jan 22 17:41:08 2007}is the Time Stamp0is the Message ID which indicates that it is BUFFER type Binary Message. Message ID 1 is for ASCII message and it is not supported by log viewer, Message IDs other than 0 and 1 are of TLV type Binary Message.( 0x6d 0x53 0x27 0x2a 0x97 0x22 0x1e 0x34 )This is the hex value of each message byte separated by a space.- online log viewer doesn't interpret the message part in case of BUFFER type records, it simply prints each byte of the message.
Using Offline GUI Log Tool
OpenClovis Offline Log Tool is an interactive GUI utility that allows you to view log files in a readable format and provides support for navigation, filtering and sorting of the log records. The Offline Log Tool only works on binary log files. To view ASCII log file simply open them with your favorite editor.
Getting Started
This provides information to launch the GUI Log Tool and helps you familiarize with its features.
How To Launch?
The Log Tool is installed in the <installation_directory>/sdk-3.0/bin directory during OpenClovis SDK installation.
If you have created the symbolic links during OpenClovis SDK installation, execute the following command:
# cl-log-viewer
If you have not created the symbolic links during OpenClovis SDK installation, go to the <installation_directory>/sdk-3.0/bin directory and execute the following command:
# cl-log-viewer
Alternatively, you can go to the <installation_directory>/sdk-3.0/logviewer directory and execute the following command:
# ./logViewer.sh
Using 'cl-log-viewer' approach to launch the Log Tool is encouraged.
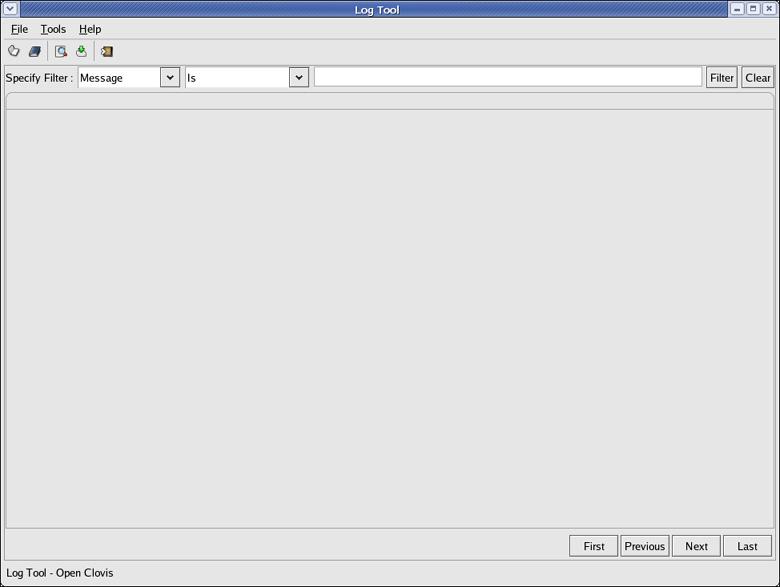
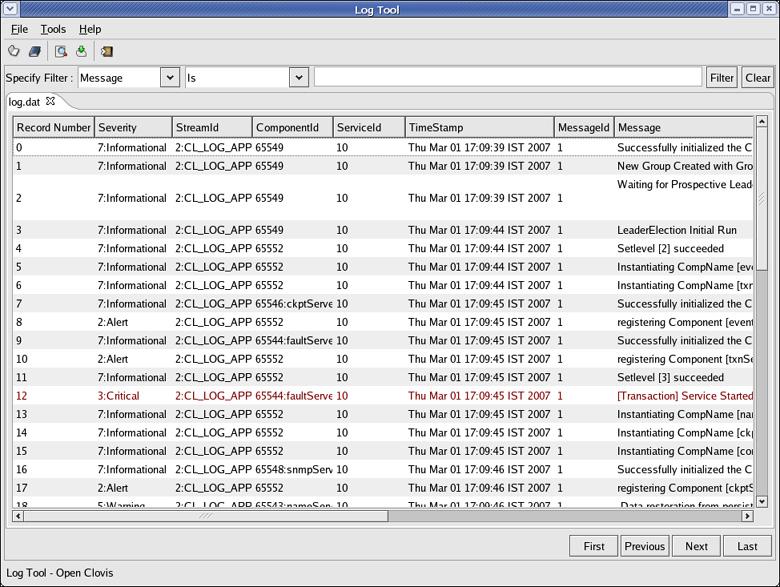
The Log Tool window is displayed.
Using Menus
Log Tool has the following three menus:
- File - The File menu has options that allow you to open a file, close the current open file, close all open files, and exit the tool.
- Tools - The Tools menu has options that allow you to create and save filters, access the saved filters, and configure settings for the filter location and the mapping file.
- Help - The Help menu provides information about the Log Tool.
Using Toolbar
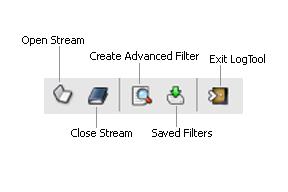
The add-on icons for the Log Tool are as shown.
- Open Stream icon - Use this icon to open a Log file.
- Close Stream icon - Use this icon to close a Log file.
- Create Advanced Filter icon - Use this icon to create, apply, and save filters.
- Saved Filters - Use this icon to apply the saved filter to a set of records.
- Exit Log Tool - Use this icon to close the Log Tool window.
Viewing Log Files
This section provides information to open log files, use filters to customize views, configure the user directory, and mapping file locations.
Key Topics :
Opening Log File
To open a Log file:
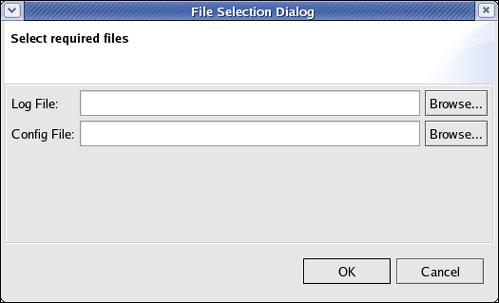
- From the File menu, click Open or press Ctrl+O. The File Selection Dialog dialog box is displayed.
- Enter the following:
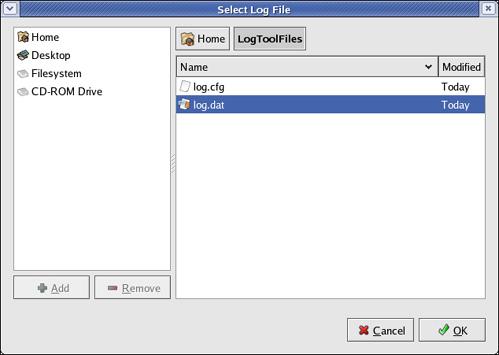
- Log File - Click Browse. The Select Log File dialog box is displayed. Specify the binary Log file that you need to view. The log file has the log records in the binary format. Click OK. The Select Log File dialog box closes.
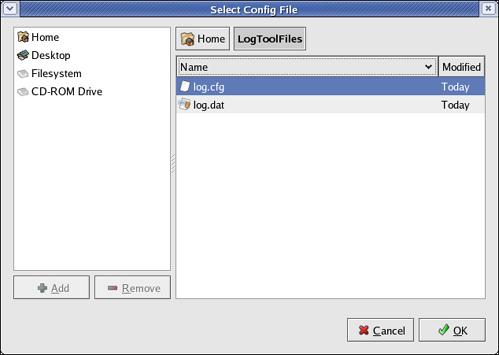
- Config File - Click Browse. The Select Config File dialog box is displayed. Specify the configuration file that configuration data (such as record length, component ID mapping, and stream ID mapping) for the log file. Click OK . The Select Config File dialog box closes.
- In the File Selection Dialog dialog box, click OK. The selected Log file opens in the Log Tool window.
Validations are performed to check if you have specified the correct files. If the files are not correct, the corresponding error message is displayed.
Sorting Log Records
You can click each column header to sort the entries. Every time you click the column header, the direction of sorting changes. Sorting is applicable for the current batch of records only.
Listing Log Records
The following options are provided for listing Log Records:
- Click First to view the first batch of records.
- Click Next to view the next batch of records.
- Click Previous to view the previous batch of records.
- Click Last to view the last batch of records.
Using Filters
This chapter provides information on using basic filter, creating and saving filter and using saved filters.
A typical log file generally contains large number of entries. When you need to troubleshoot a problem, only certain entries may be relevant. For example, you may need to view logs with severity level 3. You can use filters to view the log file based on certain criteria to create customized views. You can also save the filter criteria and use it at a later time.
Key Topics :
Using Basic Filter
Basic filter comprises the drop-down lists available in the Log Tool window.
To filter records using the basic filter:
- From the first drop-down list, select the filtering option. The options available are:
- Record Number
- Severity
- StreamId
- ComponentId
- ServiceId
- TimeStamp
- MessageId
- Message
- From the second drop-down list, select the type of filtering. The options in this list is displayed based on your selection in the first drop-down list.
- Based on these two selections, you can perform one of the following:
- In the text box, enter the filter criteria.
- In the value selector, specify a value.
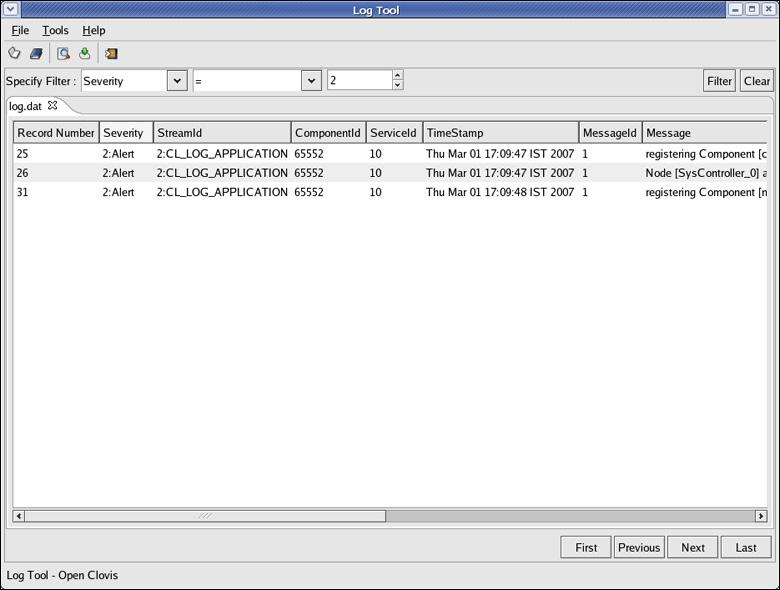
- Click Filter. The records are filtered and displayed based on the specified criteria. Figure Filtered List shows the records filtered based on Severity 2.
- Click Clear to clear the applied filter and display the records from the start of the file.
The following table provides information about the various filter options and the types:
| Filter Option | Filter Type |
|---|---|
| Message |
|
|
Severity
|
|
Creating and Saving Filter
You can create and save filters so that you can apply the saved filters to a set of records at a later time.
To create a filter:
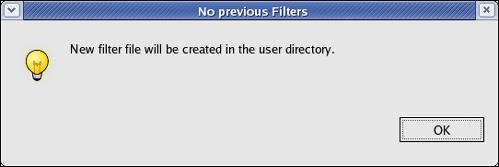
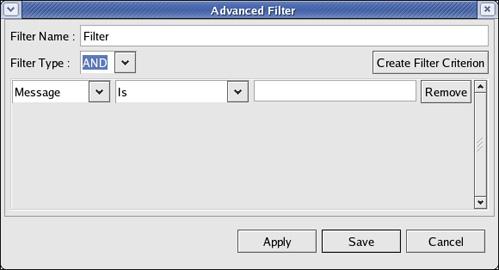
- From the Tools menu, click Advanced Filter or press Ctrl+F. The No previous Filter dialog box is displayed if you are creating a filter for the first time. Otherwise, the Advanced Filter window is displayed.
- Click OK. The Advanced Filter window is displayed.
- Enter the following information:
- Filter Name: This is the name for the new filter.
- Filter Type: Select the type of the filter. The available options are:
- AND - Select this option if you need all the criterion to be satisfied.
- OR - Select this option if at least one of the criteria has to be satisfied.
- Click Create Filter Criterion to specify the criterion in the drop-down lists.
- From the first drop-down list, select the filtering option.
- From the second drop-down list, select the type of filtering. The options in this list is displayed based on your selection in the first drop-down list.
- Based on these two selections, in the text box, enter the filter criteria or specify a value. If you select TimeStamp as the filter type in the first drop-down list, you need to specify the date and the time as the values.
- Click Apply to apply the filter to the existing records.
- Click Save to save the filter.
Click Remove to remove a filter criteria.
Click Cancel to cancel creating the filter.
Using Saved Filter
To use a saved filter:
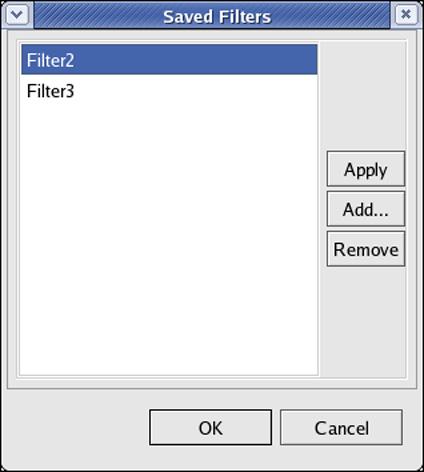
- From the Tools menu, click Saved Filters or press Ctrl+S. The Saved Filter dialog box displays the list of saved filters.
- Select the filter that you need to apply and click Apply. The selected filter is applied to the existing records.
- To add more filters, click Add. The Advanced Filter window is displayed. For information to create and save a filter, refer to the section Creating and Saving Filter.
- To remove a saved filter, select the filter and click Remove. The selected filter is removed from the list.
- Click OK to close the Saved Filters dialog box.
- Click Cancel to cancel the process of applying a saved filter.
Configuring User Directory and Mapping File Location
To configure the location for user-defined filters and mapping files:
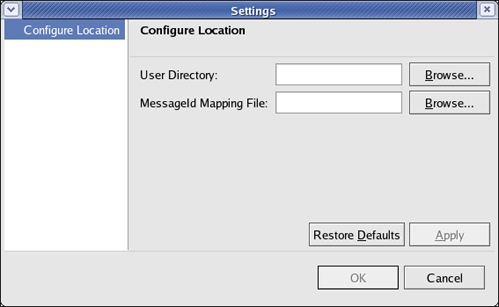
- From the Tools menu, click Settings or press Ctrl+T. The Settings window is displayed.
- Enter the following information:
- User Directory: This is the directory where the created filters are saved. This must be an existing directory.
- TLV Mapping File: This is the directory where the mapping file for the MessageId is stored. A log file represents the MessageIds in a sequence of bytes. The mapping file contains the string representation for these MessageIds. If you specify a mapping file, then the corresponding string representation for the MessageId is displayed when you open the Log file using the Log Tool. If you do not specify the mapping file, then the MessageId is displayed as a sequence of bytes.
- Click Apply to apply the configured locations to the current open Log file.
- Click OK to save the settings.
Click Restore Defaults to restore the default locations.
Click Cancel to cancel the settings.
Closing Log File(s)
To close a Log file, from the File menu, click Close or press Ctrl+C. The Log file that is currently open is closed.
To close all open Log files, from the File menu, click Close All or press Ctrl+Shift+C. All Log files that are open are closed.
Exiting Log Tool
To exit from Log Tool, from the File menu, click Exit tor press Ctrl+X . The Log Tool window closes.

